


We believe inference is a crucial part of any production AI business. It's the layer that takes a trained model and actually serves it to customers, and how well it runs shapes the economics of everything built on top of it.
At Maincode we're among the first in the world to have the AMD MI355X fully deployed in production, running Matilda in our own datacenter here in Australia. That gave us a rare chance to understand this hardware deeply, and to ask a question of our own. The framework most teams reach for to run inference on AMD is ROCm, and ROCm was developed at a different time, with different tools, to do a much broader job. We wondered whether, by treating inference as a discrete problem in its own right and bringing modern languages, modern practices, and the current state of the art to it, we could do meaningfully better and give Matilda's customers genuinely state-of-the-art inference.
The short version is that on the parts that matter most for serving, you can. Take the small all-reduce that tensor-parallel inference runs for every token. RCCL, AMD's communication library, is genuinely good at it and has years of careful work behind it, and it also has to be good at everything else a runtime is ever asked to do. A layer that only has to serve inference on one chip can set all of that aside and shave its overhead down to almost nothing, and on that one operation it comes out ahead, sitting on what looks to be the physical floor of the hardware. That edge comes from doing one thing instead of everything, and it's the result that told us the approach was worth pursuing. The rest of this post is how we got there, and what the chip taught us along the way.
A quick map of the stack
The AI stack, in its simplest form, starts with the tin. For us that's the MI355X. Above the silicon sits the runtime, ROCm on AMD and CUDA on NVIDIA, and above that the inference layer, the frameworks like vLLM and SGLang that most people actually touch. It's a simplified picture and it leaves out training entirely, but it's enough to see the shape of things.
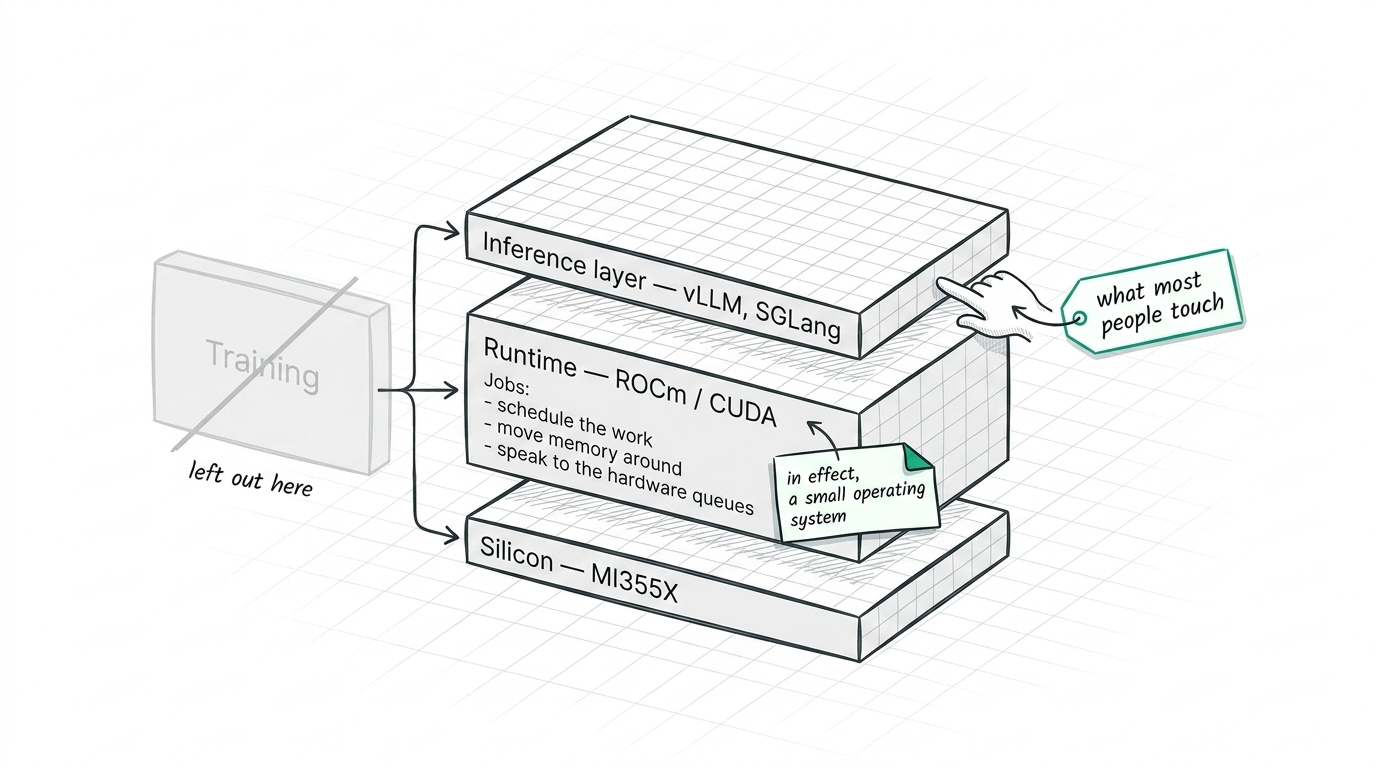
What matters is why the middle layer is there at all. To make a GPU serve tokens, the model's weights have to be run by the chip, and something has to stand between your code and the silicon to schedule that work, move memory around, and speak to the hardware queues. That something is, in effect, a small operating system, and on AMD it's ROCm. It's where most of our journey started, and runtimes like it are genuinely hard pieces of software to get right.
What's the hard thing?
At Maincode we have a habit of asking what the hard thing is, the part of a problem most people build around rather than through. For inference on the MI355X, the hard thing was going underneath the runtime and finding out how close to the silicon we could actually get.
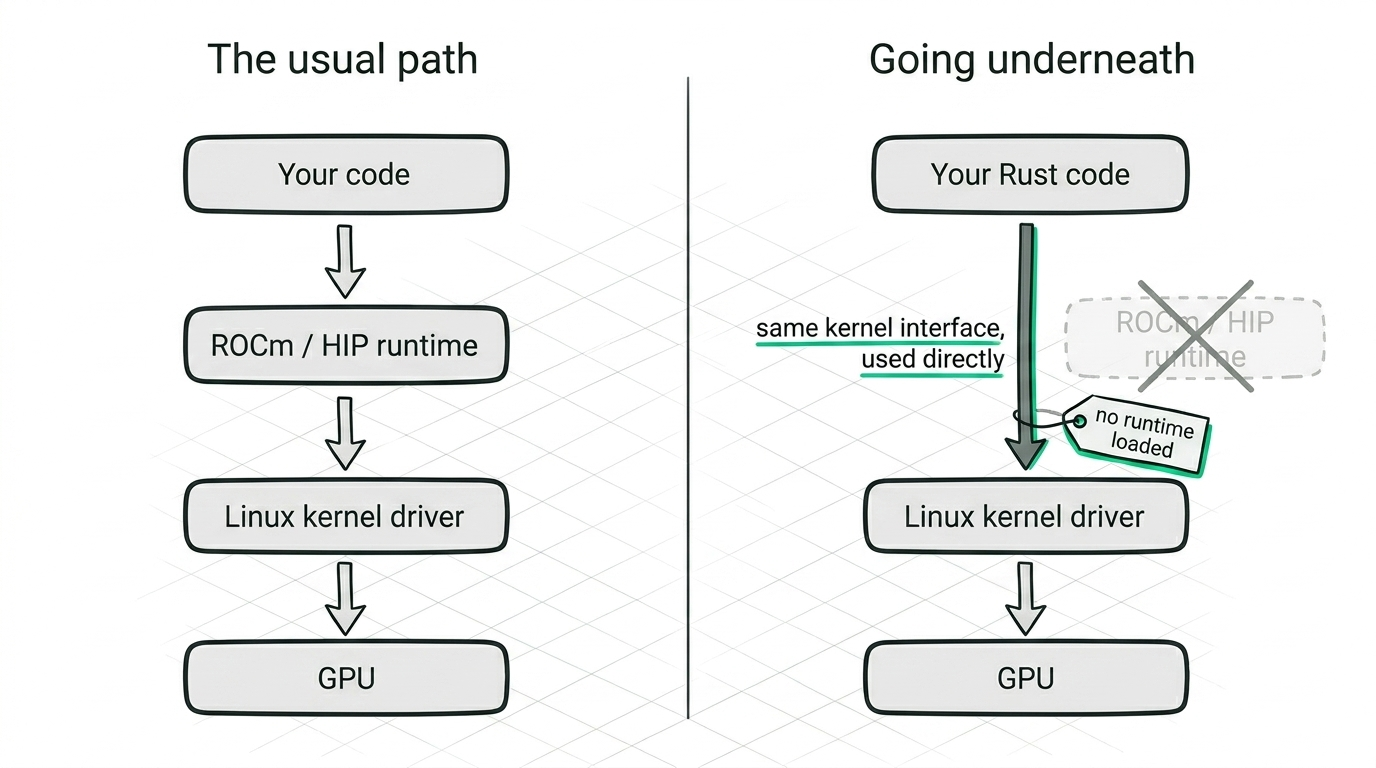
That is what we built. A stack written in Rust that does inference and nothing else, driving the GPU through the Linux kernel driver directly, with no ROCm, HIP, or other runtime loaded while it runs. It's the same kernel interface the runtime itself is built on, used directly, and because it only ever has to serve one model on one chip, it can make choices a general-purpose runtime never could. It's a big bet and we're early in it, but it has already taught us more about this hardware than the years we spent working above the runtime did. What follows is some of what we've found. We'll share the lessons freely, and we'll say clearly where we're keeping a few of the specifics to ourselves.
Talking to the chip directly
Going below the runtime means taking on its job. You open the device, you ask the kernel for a command queue, and from then on the conversation is small and exact. You write a command packet into a ring buffer, you ring a doorbell, the command processor on the GPU wakes up and does the work, and when it's finished it updates a signal you've been watching. That's the whole loop, and every word of it hides a detail the runtime normally handles for you.
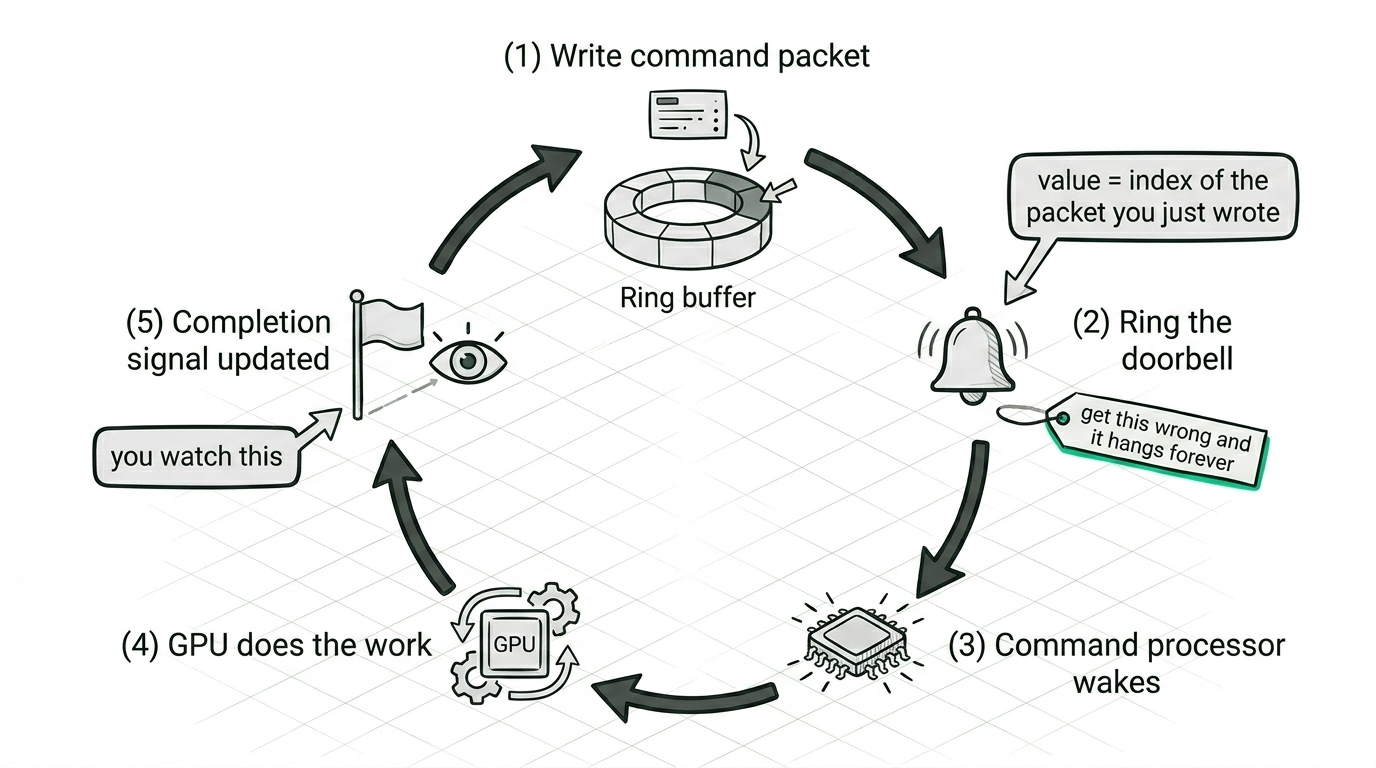
The doorbell is a good example of how exact it is. You tell the command processor to go by writing a value, and that value has to be the index of the packet you just wrote rather than the number of packets in the ring, and if you get it wrong the first dispatch works and the second one hangs forever while you stare at a kernel that's perfectly fine. There are a dozen edges like that, in how a dispatch is described down to the byte, in how completion is signalled so you never read half-written memory, in where a kernel expects to find its arguments. The early weeks were not smooth and we won't pretend otherwise. But once it works there is nothing standing between your intent and the machine, and that turns out to be the entire point.
What the MI355X is actually like, underneath
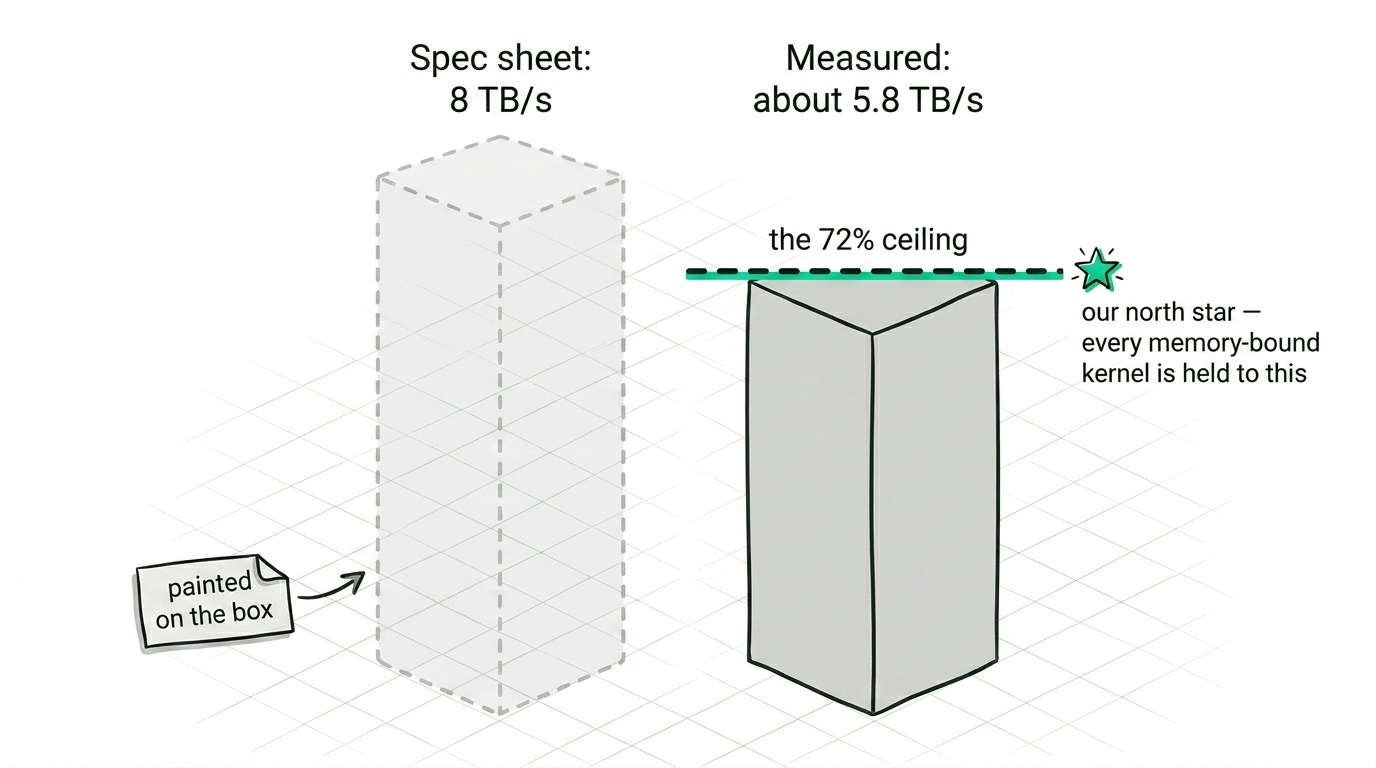
A spec sheet tells you the MI355X has 288 GB of HBM3e and somewhere around 8 TB/s of memory bandwidth, and both numbers are true and neither is the one you can build on. The number that matters is what the chip actually sustains under a real access pattern, so one of the first things we did was write the simplest streaming read we could and measure it. A well-shaped read tops out at about 72% of the theoretical peak, and that figure became a kind of north star. Every memory-bound kernel we write gets measured against the 72%, not against the 8 TB/s painted on the box, and the moment a kernel stalls well below it and stops responding to our changes, we know to stop polishing the kernel and go find the real bottleneck somewhere else.
We learned that one the expensive way. A pipeline that should have been fast sat at a fraction of its speed through three separate rewrites that all landed on the same disappointing number, and the cause turned out to be a single small buffer we'd put in host memory instead of on the device, so every touch of it was quietly crossing the bus. On the raw interface you own exactly where every byte lives, and we treat that with a great deal more respect now.
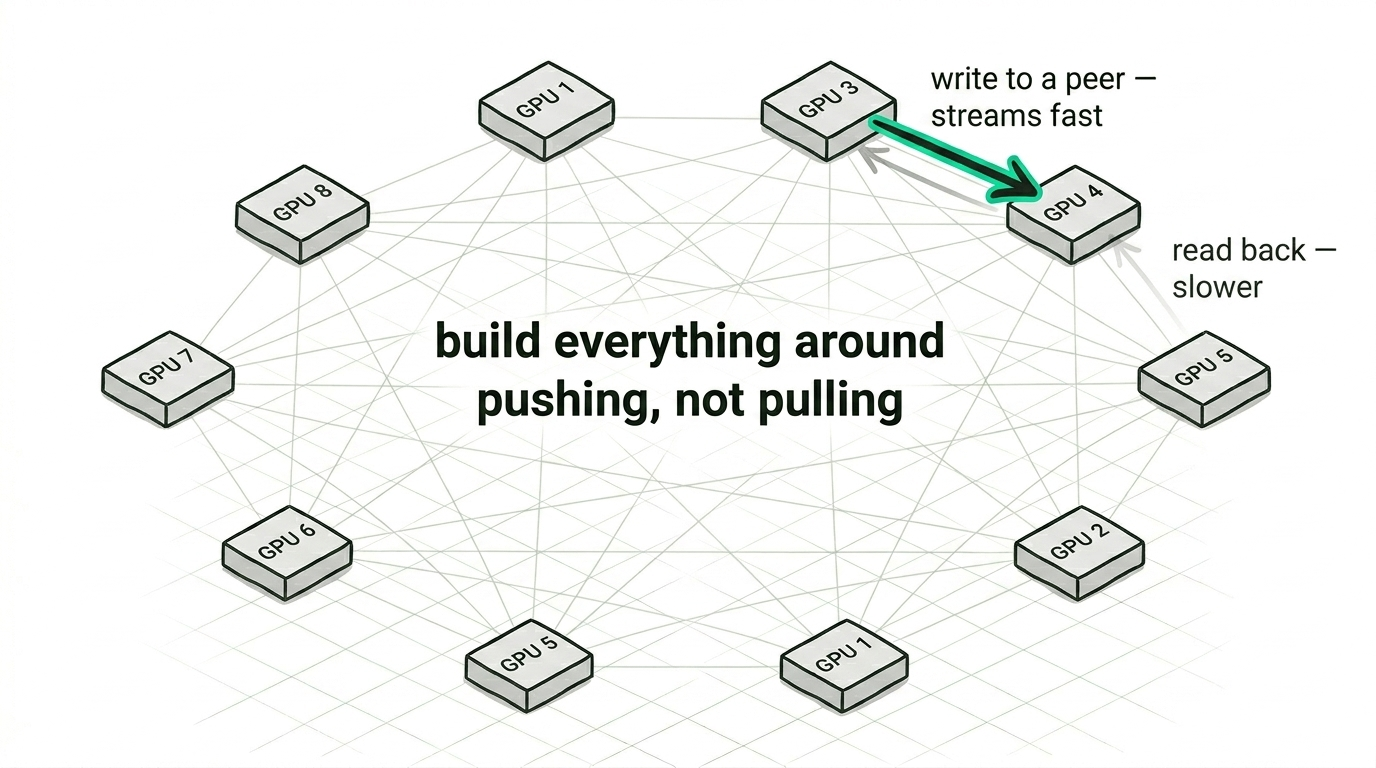
The interconnect has a personality too. The eight GPUs in a node are wired all-to-all, and the fabric is not symmetric, because writing data into a peer GPU streams far better than reading it back out. That single observation reshaped how we move data between GPUs, since you build everything around pushing rather than pulling. We also found we could keep the GPUs in step from inside the kernels themselves, leaning on the hardware's own memory ordering across the shared address space rather than going back to the host to synchronise, and the chip is very willing to do this if you ask it the right way. Most software never has a reason to ask.
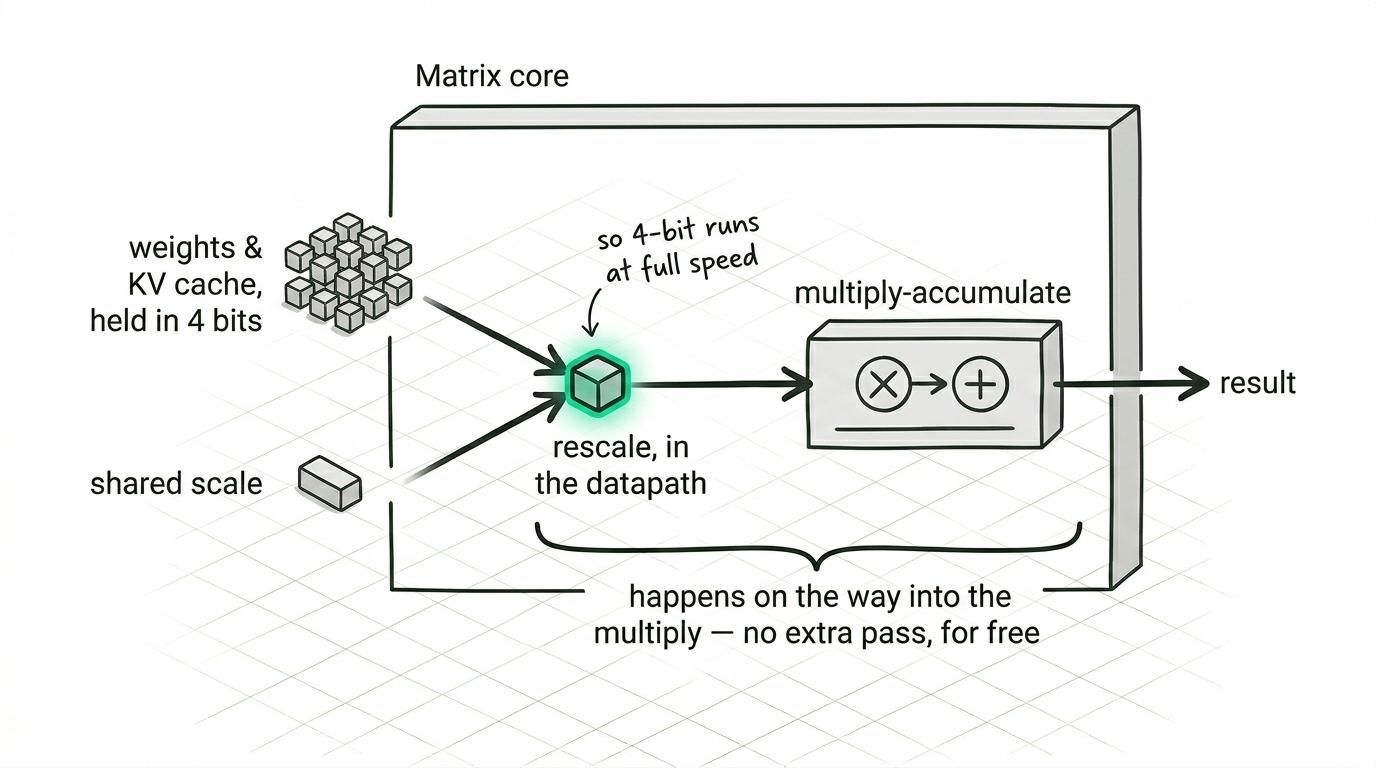
Then there are the matrix cores, which on this generation are the part that genuinely surprised us. They understand very low precision number formats natively, with a shared scale applied right in the datapath on the way into the multiply, so you can hold weights and cache in four bits and let the hardware do the rescaling for free. The exact behaviour of those formats, the parts that decide whether the accuracy holds up, isn't quite what the documentation leads you to expect, and the only way to know for certain is to feed the hardware known values and read back what it computed. That work is slow and unglamorous, and it's also exactly what lets you run a four-bit cache at full speed with your eyes open.
What the silicon tells you up close
One of the quieter benefits of running this hardware yourself is that the chip describes itself to you in detail through the kernel, and a fair amount of what it says never reaches a slide.
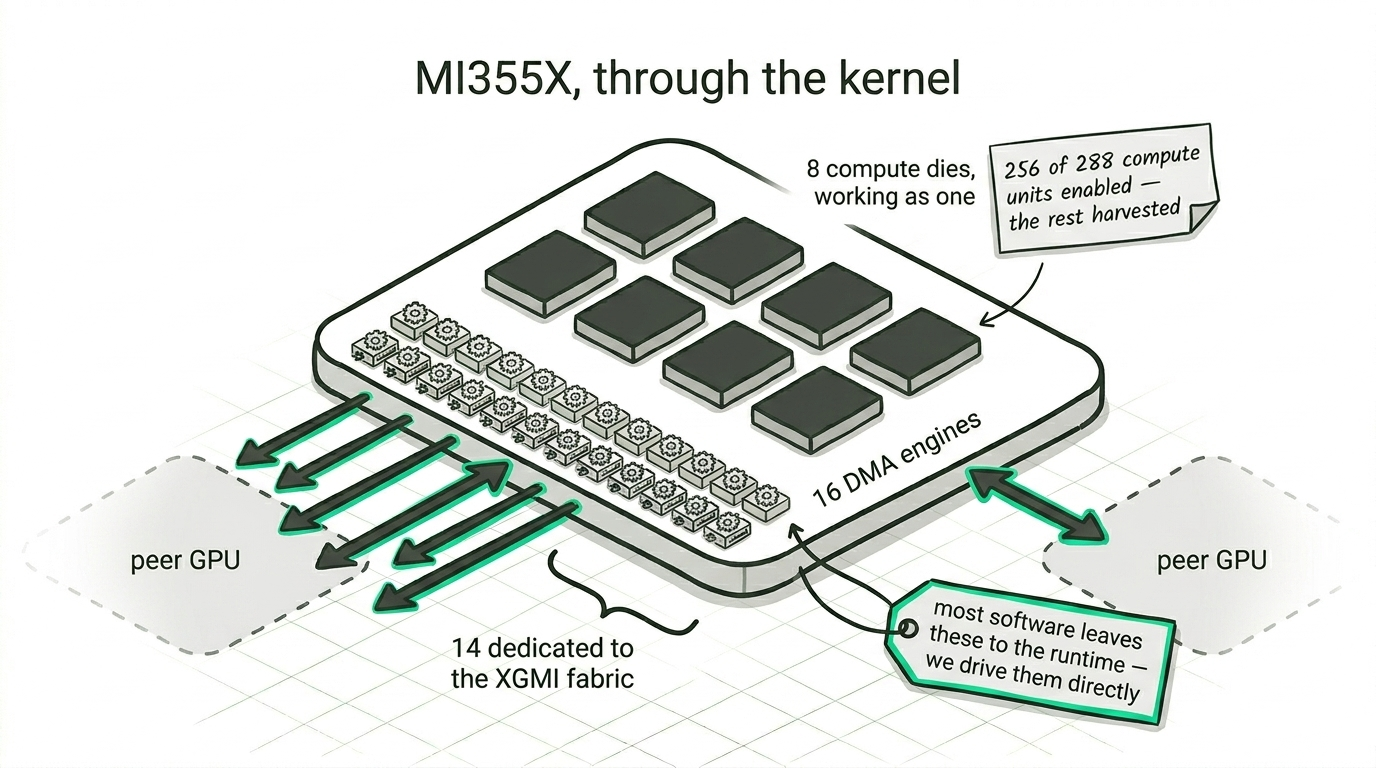
The kernel sees each MI355X as eight compute dies working as one, carrying 256 enabled compute units between them at up to 2.4 GHz. You can even watch the harvesting, because the physical layout is 288 units and exactly 256 are switched on, one disabled in each array, which is completely normal for a part this size and a good reminder that this is real silicon and not a datasheet. Every unit runs 64-wide wavefronts and keeps up to eight of them in flight at once, which is the occupancy budget you are really programming against, and each has its own 32 KB of first level cache with a 256 MB last level cache behind it.
The part we have come to care about most is the copy machinery. Each GPU exposes sixteen DMA engines, and fourteen of them are dedicated to moving data across the XGMI fabric to its peers. Most software leaves these to the runtime. We don't, and using them directly alongside the compute units is a good part of how we keep the interconnect busy. It is exactly the kind of thing you only find once you are down at this level, reading what the hardware is willing to tell you.
Collectives, and the speed of the fabric
When you run a large model across several GPUs, every layer of every token does a small all-reduce to combine partial results, and at one token at a time those reduces are tiny. What you care about then isn't bandwidth, it's latency, the handful of microseconds between having your piece of the answer and everyone having the sum.
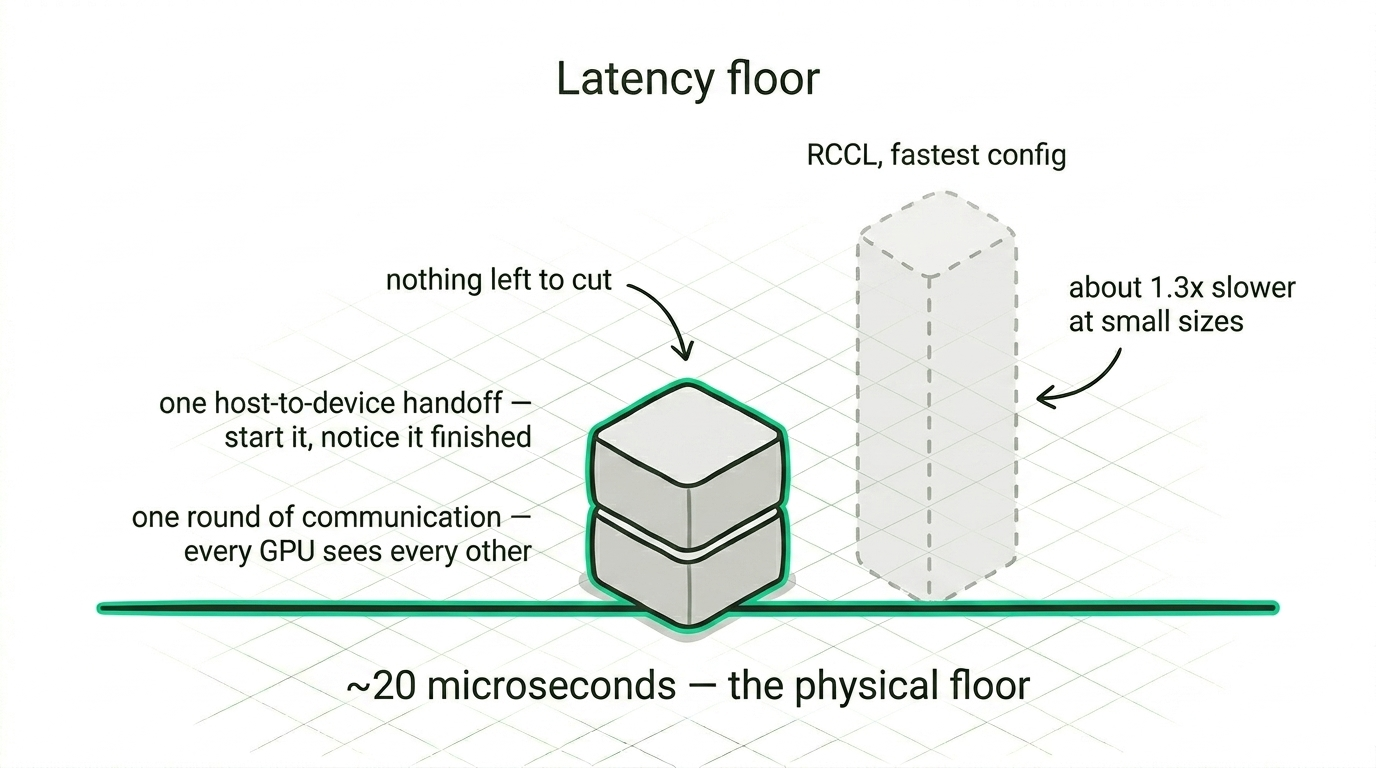
Rather than ask how fast our all-reduce was, we asked how fast any all-reduce could possibly be on this fabric. We built it several ways, stripped each one down to its essentials, and measured until the number stopped moving. It settles on a floor, and the floor comes from two costs that nothing removes, one genuine round of communication so every GPU sees every other's contribution, and one handoff between the host and the device to start the work and notice it has finished. There is nothing underneath that.
We sit on that floor. At the small message sizes tensor-parallel inference actually uses, that comes out around 1.3 times faster than AMD's own RCCL at its best, which a specialized, inference-only layer can manage precisely because it carries so little overhead, reaching the floor from a single host thread. We'll walk through how in a later post.
A million tokens
The point of all of it is inference, and at long context inference is almost entirely a memory problem. Every token a model generates has to read the whole history it's attending to, so the speed is set by memory bandwidth and by how few bytes you spend on each entry in the cache.
We built the decode attention path from the ground up against that 72% ceiling, and at million-token context the streaming phase runs at around 60% of HBM bandwidth, which is close to what the chip will give a memory-bound kernel at that scale. Every other piece of the decoder, the norms, the rotary embeddings, the activation, the projections, the mixture-of-experts routing, and attention itself, runs on that same direct path, and together they assemble into a working autoregressive loop that generates tokens end to end. To know the assembly is right we validate the whole decoder in its bare datapath against a 64-bit reference at every step, and the two agree to within about a part in a thousand, which tells us the math, the memory layout, and the control flow are all correct.
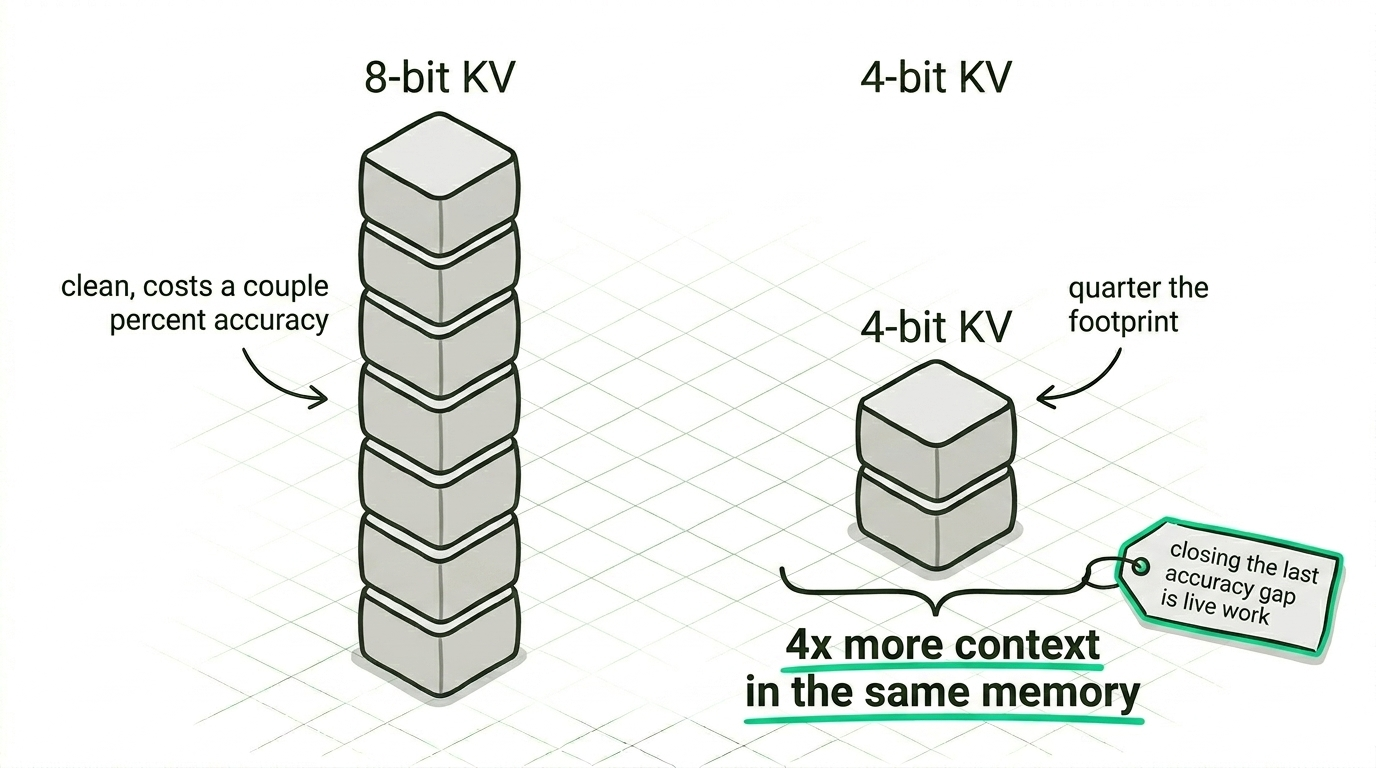
Cache precision is a separate question, and one we're still working through. Eight-bit KV costs only a couple of percent of accuracy on realistic data and is clean enough to lean on, while four-bit quarters the footprint and quadruples the context you can hold in the same memory, and closing the last of its accuracy gap is live work rather than a solved problem.
We're not going to pretend the perf-tuned, full-scale serving system is finished, because it isn't, and there is a lot of work still ahead of us. What is done is the hard foundation, every operator the model needs running on bare hardware, validated, with the whole architecture generating tokens. The rest is the kind of systems engineering we expect to take real time to get right.
The numbers
We try not to make a performance claim without saying exactly what we measured, so here is where the stack sits today on a single node of eight MI355X GPUs. None of these are peak figures off a slide. They're what it does when you run it, which is the only kind of number we find interesting.
| What | Where it lands |
|---|---|
| HBM streaming ceiling (measured, not spec) | ~5.8 TB/s, about 72% of peak, the bar every memory-bound kernel is held to |
| Decode attention at 1M-token context | ~60% of HBM bandwidth in the streaming phase |
| Grouped-query, paged, 4-bit KV | ~33 µs to attend over a 1M-token cache, per head, as a microbenchmark, at 4× compression |
| Small-message all-reduce, 8 GPUs | ~20 µs, the fabric's latency floor, roughly 1.3× faster than RCCL's fastest configuration at the sizes decode actually uses, from a single host thread |
| Full Qwen3-235B-A22B decoder | runs end to end generating tokens, with the bare datapath matching a 64-bit reference to about a part in a thousand every step |
The all-reduce result is the one we're quietly happiest about, because it isn't a clever trick, it's the absence of overhead. Twenty microseconds is, as far as we can measure, the physical floor for that operation on this fabric, one round of communication plus one handoff with nothing left to cut, and being right at the floor from a single thread is what taking the runtime out actually buys you.
Don't take our word for it
A performance number you can't reproduce isn't worth much, so the whole thing ships as a single self-contained container image. The GPU kernels are compiled into the binary, so there is nothing to install, no ROCm, no Python, no framework. On any machine with MI355X GPUs the whole demonstration is three commands.
IMG=docker.io/maincodehq/mainarch:v0.1   # the exact build this post describes
GPU="--device /dev/kfd --device /dev/dri --security-opt seccomp=unconfined --ipc=host"

docker run --rm $GPU $IMG gpu-allreduce-bench   # the 8-GPU all-reduce sweep
docker run --rm $GPU $IMG attn-decode           # the 1M-context attention bandwidth
docker run --rm $GPU $IMG model-decode          # watch the full decoder generate tokens
Every number in this post comes from that single tagged build, mainarch v0.1, so what you run is exactly what we measured. There is no runtime to set up and no environment to get right, just the image and the GPUs. The commands above use docker, and on rootless podman you want to add --group-add keep-groups so your render group membership reaches inside the container and lets it open the kfd device. If you want the head-to-head, run AMD's own rccl-tests on the same box with all_reduce_perf -t 8 -g 1, which is RCCL at its fastest, and compare at the small message sizes. We would genuinely rather you checked it than took our word for it.
Where this goes
There is a lot we have skipped past here, and we'll go deeper in future posts, and some of the specifics, the exact way we win the last stretch of performance, we are keeping to ourselves for now. Not because any single piece of it is magic, but because the result is a thousand small, measured, chip-specific decisions stacked on top of each other, and that accumulation is the part that is genuinely ours.
What we keep coming back to is how much there is to gain simply by closing the distance between your code and the silicon, once you're willing to take on the work the runtime usually does for you and to be wrong on real hardware enough times to get it right. It's a privilege to be doing that here, on our own MI355X hardware, in our own datacenter, with Matilda as the thing we are building toward.
We asked what the hard thing was. This is it, and we are enjoying every microsecond of it.