


Australian clubs already live in a world of GPS tracks, wellness surveys and mountains of match stats. The next edge is not more data, it is clearer answers to simple questions: what is likely to happen on the weekend, why does the model think that, and what could we change to tilt the odds. That is the problem we set out to solve and AI models are the best technical lever we have to bridge that gap.
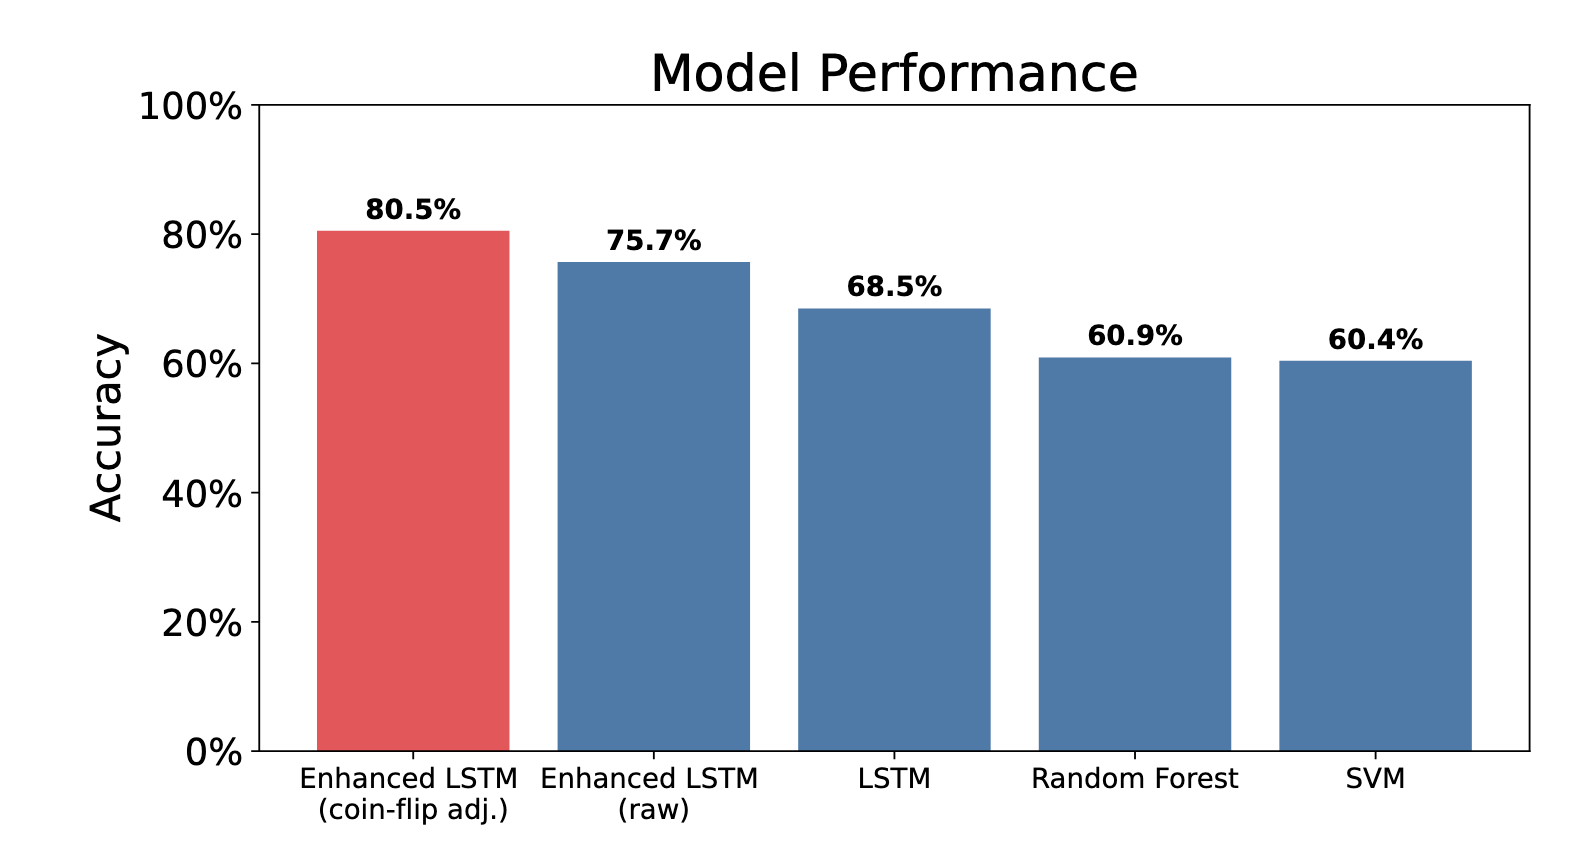
On our historical sample of 1,269 AFL games our AI system achieves 75.7 percent raw prediction accuracy and an adjusted 80.5 percent on fixtures that are not genuine coin flips. More importantly, it does not just provide black-box predictions but supports them by explanations and allows the user to simulate ‘what if’ scenarios.
While we focus on Australian rules football for our initial exploration, we believe our predictive modelling approaches will work in other sports as well as other tactical decision making arenas as well.
This article gives an overview of the work and key findings, while the full technical detail of this research is available in our technical report. The research was led by Maincode engineer Yue Yang. The technical report can be accessed here.
Why we are working on this
Coaches and list managers tell us the same three things:
- Forecasts that cannot be explained do not make it into the meeting room.
- Everyone has ratings and tips, but very few tools show what is driving a forecast in language that a coaching group can use.
- Scenario testing is missing. Clubs want to ask what if our key forward is unavailable, what if we tighten inside 50s, what if our goal accuracy returns to normal.
Our work focuses on delivering trustworthy probabilities, explainability, i.e. the reasons behind them, and “what if” analyses that show how the outcomes predictions change .
Where the opportunities are for clubs
- Match preparation
See the drivers of a result in plain English, grouped into areas coaches recognise, such as scoring efficiency, team form, ball movement, contest pressure, territory, and context like venue history. - Selection and load management
Stress test likely outs or restricted minutes and quantify the swing in win probability. - Tactical emphasis
Explore which levers move the needle for a given opponent. For example, how much does improving forward-half retention or shot quality matter this week. - Recruitment and development
Track which attributes consistently lift a club’s chances over months, not just a single game. - Communication
Use calibrated probabilities supported by clear natural language rationales to align staff, players and execs.
What is unique about our approach
Most AFL models start with Elo or Poisson features and a simple classifier. That baseline is proven and sensible. We build on that foundation, then add three things clubs keep asking for:
- Sequences that capture form
The model reads each team’s last 12 games as a timeline, not a flat table. That helps it learn momentum, stability and trend. - Cross team matchup attention
Instead of rating teams in isolation, the system learns interaction patterns between the two sides, which better reflects how styles clash. - Explainability first
Every prediction is broken into grouped contributions that map to how coaches talk about footy. We use SHAP based explanations and show the effect size of each driver, not just a feature importance list.
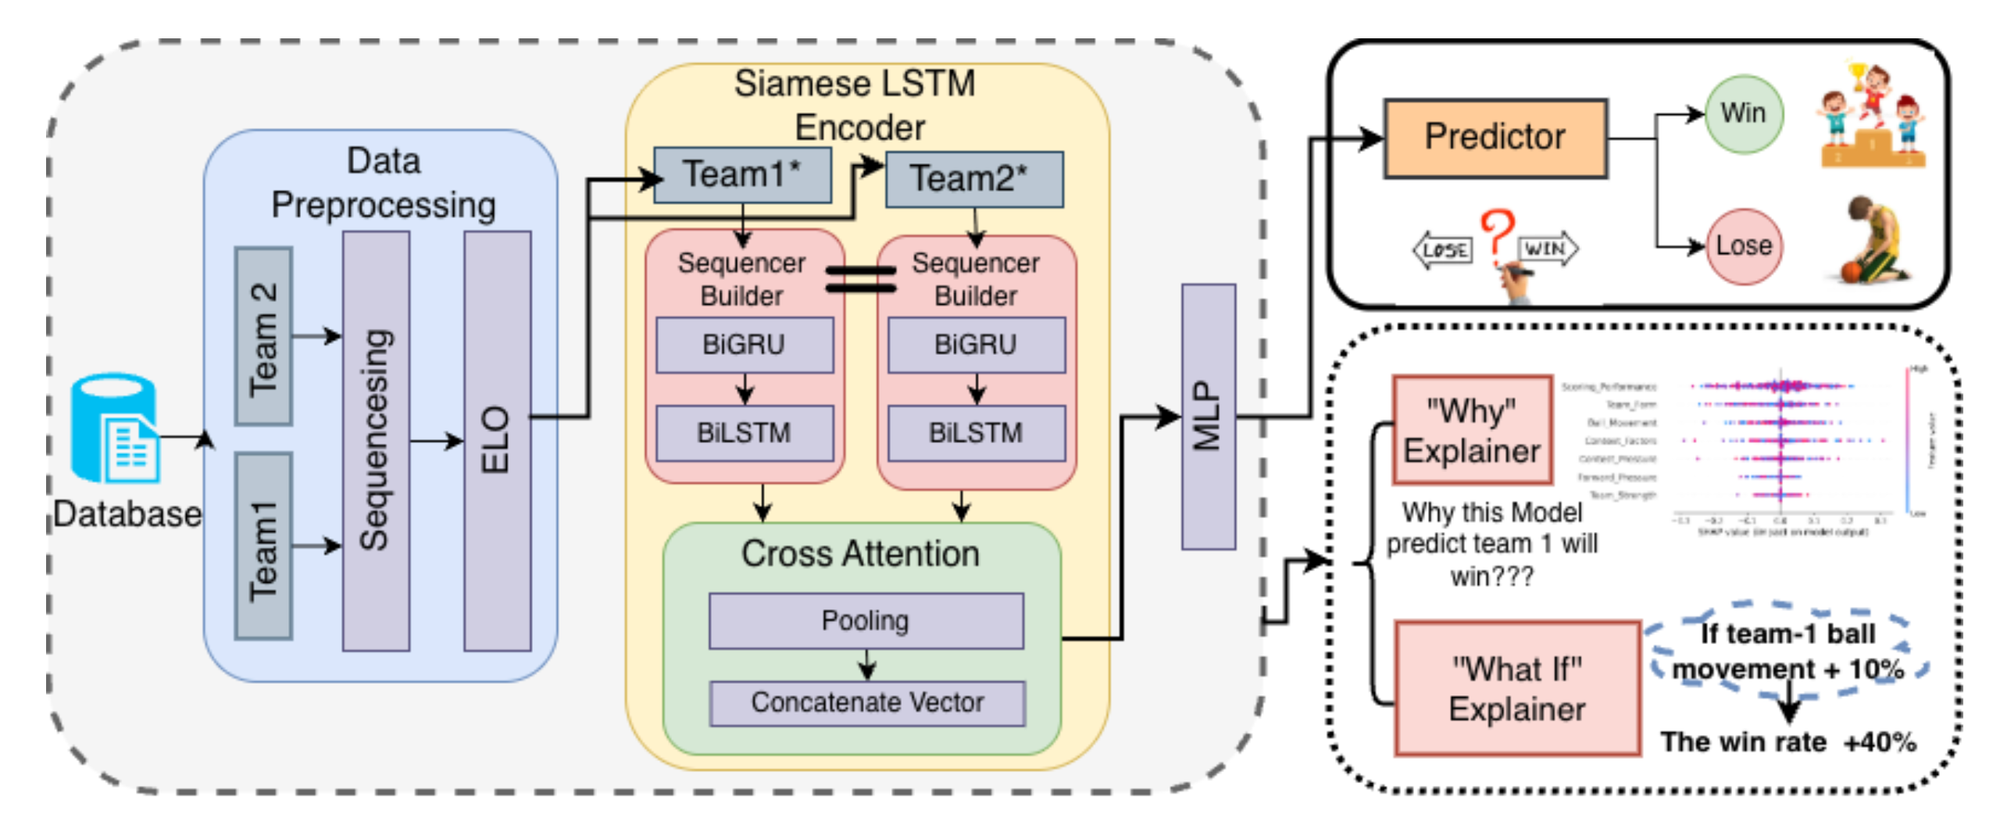
AI model as an explainable, predictive engine
On a more technical note: we combine well known signals such as Elo and venue effects with rolling statistics and momentum indicators, then process each team’s 12 game sequence with a compact GRU plus LSTM encoder and a multi head attention layer. A cross team attention stage models matchup dynamics before a simple head produces a calibrated win probability. We also provide a counterfactual tool that reruns the model under realistic tweaks so you can test injuries or tactical shifts. The point is credibility and practicality, not black box complexity.
On our historical sample of 1,269 AFL games the system achieves 75.7 percent raw accuracy and an adjusted 80.5 percent on fixtures that are not genuine coin flips. More importantly, it is well calibrated and will say fifty fifty when that is the truth.
We use SHAP values to make the model’s reasoning transparent. For every prediction, SHAP breaks down how each factor, such as scoring performance, team form, ball movement, or contest pressure, contributes to the final win probability. Positive values push a team’s chances up, while negative values pull them down. This allows coaches and analysts to see not just what the model predicts, but why it thinks that way, using the same language they use to discuss the game.
Re-running our model for different configurations then allows to simulate alternative 'what-if' scenarios.
Applying the approach to the Grand Final
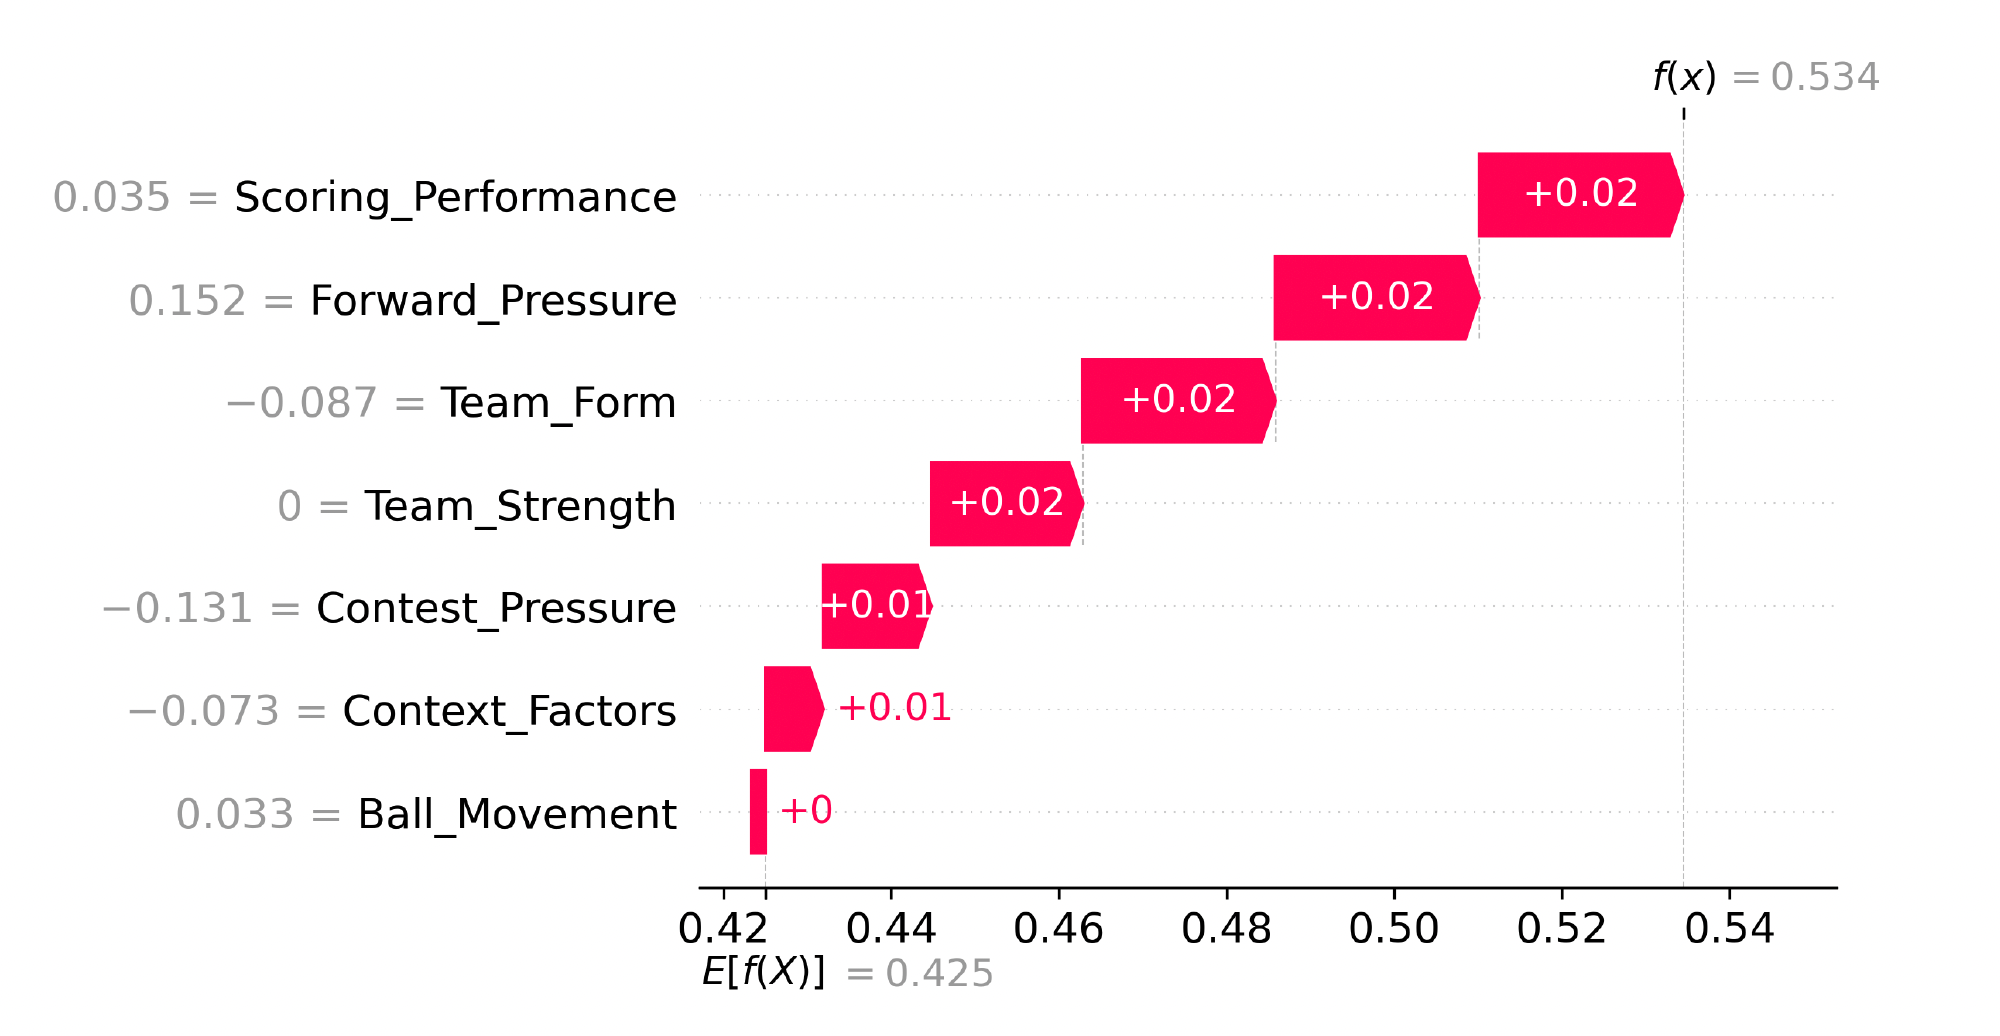
As a case study, we ran the 2025 AFL Grand Final through our predictor. On pre match data, the model gave Geelong a narrow edge, a 53.4 percent win probability, only slightly above Brisbane’s 46.6 percent. The margin was tight, but the model tipped Geelong based on strong scoring efficiency and recent form.
Those factors were also what most observers saw leading into the decider. Geelong had been converting chances cleanly and carrying momentum through the back half of the season. Brisbane’s contest pressure was stronger on paper, but Geelong’s consistency and finishing power kept them marginal favourites.
After the game, we simulated an alternate scenario in which Geelong lost their key forward early. In that simulation, Geelong’s win probability dropped to 43.84 percent, which flipped the expected result in Brisbane’s favour. That is exactly what unfolded on the day, when Geelong lost their forward and Brisbane took control.
This outcome shows how scenario testing can mirror reality. Being able to explore potential disruptions helps quantify risk, guide contingency planning, and make the impact of player availability and structure clearer before decisions are made.
Where we are heading next
- Deeper player level data to better capture the effect of individuals on the team dynamic
- Richer context such as weather and travel to improve robustness.
- Uncertainty quantification so staff can see confidence intervals, not just point estimates.
- Live in-week updates as information changes.
Our ambition is to take this beyond AFL. The same sequence based, explainable approach works for codes with rich temporal structure and clear possession or scoring phases, including NRL, rugby union, Super Netball, A League, NBL and WNBL, and men’s and women’s cricket across BBL and WBBL.
We would love to partner with performance and analytics teams to adapt the inputs, learn the nuances of each sport, and stand up calibrated, scenario ready models that fit your weekly workflow. If your club or code is exploring this space, let’s talk and co design a pilot on your recent fixtures.


